
Hansen Solubility Parameters in Practice (HSPiP) e-Book Contents
(How to buy HSPiP)
Chapter 19, Saving the planet (Finding Improved Environmental Solutions)
HSP are proving versatile in their ability
to contribute to lots of small steps. So here we have a selection of examples.
HAP
substitutions
The USA lists chemicals considered to be
Hazardous Air Pollutants. If you happen to be using one of these as a solvent
then there is considerable pressure for you to substitute it with a non-HAP
variant. How do you do this sensibly?
The key is functionality. You need to have
the same solvating power. It’s unlikely that there is a single solvent that can
be used to replace your current solvent, so you need to find a mix of solvents
that will do the same job. Without HSP your task is very tricky.
Suppose you are using diethanolamine, with
a low (i.e. serious) HAP reporting level. What mixture of solvents will match
its particular HSP? The Solvent Optimizer quickly gives you an idea.
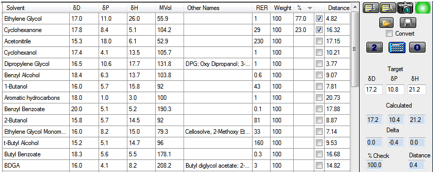
Figure 1‑1 Approximating Diethanolamine
The target values for diethanolamine are [17.2,
10.8, 21.2] and by clicking the “2” button you instantly find that the 2-best
solvents for giving a match are a 77/23 mix of ethylene glycol and
cyclohexanone. Unfortunately, ethylene glycol is also on the HAP list so you
want to exclude that from the list. Ctrl-clicking on ethylene glycol grays it
out and re-clicking “2” gives you a methanol/benzyl alcohol mix, but methanol
is also on the HAP list, so you Ctrl-click that and try again to find that a
Dipropylene Glycol (DPG)/ethanol mix is a good match. Now it’s unlikely that
you would have thought of such a mix, and you may not even be familiar with DPG.
But who knows, this mix might be just what you’re looking for.
The point of this example is that with HSP
(and some convenient software tool) it becomes routine to think through these
tricky substitution issues in a methodical and environmentally-friendly manner.
VOCs
(Volatile Organic Compounds)
The rational approach to reducing the
harmful effects of VOCs is to find chemicals of the correct chemical
compatibility and with both a low vapour pressure and a low reactivity with
ozone (as measured by the Carter MIR) and with OH radicals (Log[OH]).
HSPiP can give you all of this in one
module. The Y-MB calculator not only estimates the HSP of a chemical of
interest but uses its neural networks to estimate vapour pressure (at 25º)
as a convenient judge of how low the vapour pressure might be, plus it
calculates the Carter MIR and Log[OH]. As an additional guide, from the vapour
pressure an estimate of the RER (Relative Evaporation Rate – nBuAc=100)
is made via the empirical formula RER=0.046*MVol*VapourPressure. We’ve been
asked why MVol is necessary for calculating the RER. The Vapour Pressure is,
essentially, in moles. If you have two chemicals with the same vapour pressure,
but one has twice the molar volume, then there will be twice as much of this
second chemical in the air. It’s as simple as that! Another question is how the
RER based on nBuAc=100 is related to that based on ether. The answer is that
the ether-based system is the time
needed to evaporate rather than the rate.
nBuAc takes 12 times as long to evaporate as ether so
RER-based-on-nBuAc=12/Ether-based-system
(or 1200 if ether is 1 in its system).
Bio-solvents
What better way to replace some bad solvent
than by some bio-solvent? Well, there are arguments for and against
bio-solvents, but at least we can agree on an objective value – their
HSP. If the HSP is wrong then however bio-friendly they are, they simply won’t
be able to do the job.
A typical example is the proposed use of
FAME solvents – Fatty Acid Methyl Esters. We use the data from a typical
paper on the subject where FAME solvents were tested for applications of epoxy
resins, Y Medina Gonzalez et al, Fatty Acid Methyl Esters as Biosolvents of
Epoxy Resins:A Physicochemical Study, J Solution Chemistry, 36, 437-446,
2007.
One of the target resins was an epoxy resin
called Bisphenol A diglycidyl ether. The authors used a classic 40-solvent HSP
Sphere process to determine values shown in the table. The table includes our
S-P estimates of the HSP for two of the FAME materials.
|
Chemical |
δD |
δP |
δH |
R (or Distance) |
|
Epoxy |
17.2 |
6.9 |
8.2 |
24 |
|
Methyl caprylate
(C8) |
15.5 |
2.8 |
5.6 |
6 |
|
Methyl myristate
(C14) |
15.4 |
2.2 |
4 |
7.2 |
Table 1‑1 FAME solvents compared to an Epoxy
This would seem to suggest that FAME would
be good solvents for the epoxy and that there wouldn’t be a huge difference in
solubility between the C8 and C14 versions. But the solubilities turn out to be
disappointingly low (though they at least diminish as chain length gets longer,
as would be expected). Is this a failure for HSP? The large R for the Epoxy
looks a little odd. With a more typical value the distances would be closer to
the border of the sphere and the relative insolubility would be more explicable.
And, of course, the rather large molar volumes of the FAME solvents mean that
kinetically they will be rather poor – one of the key problems that beset
the change to “greener” solvents.
Rational
extraction
Work carried out in Professor Staci
Simonich’s team in Oregon State University T. Primbs, S. Genualdi, and S.M. Simonich,
Solvent Selection for Pressurized Liquid
Extraction of Polymeric Sorbents Used in Air Sampling, Environmental
Toxicology and Chemistry, 27, 1267–1272,
2008 is a good example of how a complex environmental sampling procedure can be
rationalised via HSP. Anthropogenic SOCs “Semivolatile Organic Compounds”
travel around the world from their sources in one region to provide pollution
in another (often pristine) region. It is a substantial challenge to collect
them then to extract them quantitatively. She uses pressurise fluid extraction,
but her problem is to ensure extraction of the SOCs without extracting
polyurethane (PU) which happen to be one of the key components of the system
for trapping particulate and gaseous materials from the air stream.
By plotting a range of typical SOCs, along
with typical solvents used in pressurised fluid extraction, choosing PU in the
Polymer form and clicking the Solvents button, the 3D plot makes it clear that
dichloromethane is too close to the PU to be of use in extraction. The 50/50
hexane/acetone looks, from the H-P plot to be a potential problem with the PU
but the RED number shows that it too is safely outside the R of this PU and so
should be useable. The favoured solvents, hexane, acetone and 75/25
hexane/acetone seem, from a visual inspection of the 3D plot to be adequate for
extracting the SOCs themselves.
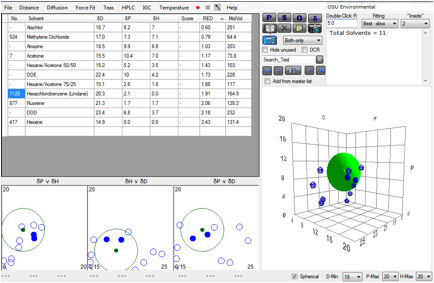
Figure 1‑2 Using file OSU Environmental
Predicting
problems
The problem of contaminants reaching the
Arctic via routes such as the one above is a major one. It has been known for
some time that pentachlorophenol [21.5, 6.9, 12.8] not only gets to the Arctic
but also accumulates to high levels in polar bears. One of us, many years ago,
spotted that the much-used fire-retardant tetrabromo-bisphenol A [20,2, 9.1,
13.8] is very close (Distance=3.5) to pentachlorophenol and would therefore be
highly likely to start accumulating in polar bears. Unfortunately for the
bears, and those who might eat the bears or the seals with the same problem,
this prediction has been vindicated. Of course the bromo flame retardants are
now being phased out, but the point of this small section is that HSP
predictions can be used with some confidence on issues that take a long time to
resolve experimentally. Clearly one can’t make long-term environmental
decisions based on HSP alone, but when difficult decisions have to be made, the
insights from HSP can be crucial.
Plastic
containers
 Although the environmental benefits of plastic containers are
contentious, there are plenty of times when they are environmentally preferred
to glass or tins. If you want to sell something for the first time in plastic,
you need to be confident that the contents will not damage the plastic by
dissolving it or causing environmental stress cracking. Because it’s relatively
easy to test for such issues, there aren’t too many mistakes made. What is not
so obvious is when you have aqueous solutions of potent chemicals such as weedkillers.
There’s no chance of the solution dissolving the container or producing stress
cracking. The problem is that any diffusion of the weedkiller through the walls
means potential skin contact for the user or leakage into the environment. A
casual examination of a typical tin of weedkiller tells you that one common
ingredient is paraquat. From the standard table we find its values are [19.5,
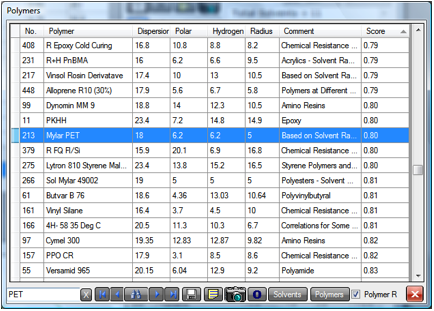
8.8, 5.9] Now let’s try to put this in a PET bottle. There are a number of
different PET values, but the R-PET data in the Polymers table is [19.1, 6.3,
9.1, 4.9] and the distance between the paraquat and the PET is 4.1, inside the
radius and therefore a warning that PET would not be a good idea. To check out
the polymers in general, select paraquat in the solvents table then click
Polymers within the Polymers form.
Although the environmental benefits of plastic containers are
contentious, there are plenty of times when they are environmentally preferred
to glass or tins. If you want to sell something for the first time in plastic,
you need to be confident that the contents will not damage the plastic by
dissolving it or causing environmental stress cracking. Because it’s relatively
easy to test for such issues, there aren’t too many mistakes made. What is not
so obvious is when you have aqueous solutions of potent chemicals such as weedkillers.
There’s no chance of the solution dissolving the container or producing stress
cracking. The problem is that any diffusion of the weedkiller through the walls
means potential skin contact for the user or leakage into the environment. A
casual examination of a typical tin of weedkiller tells you that one common
ingredient is paraquat. From the standard table we find its values are [19.5,
8.8, 5.9] Now let’s try to put this in a PET bottle. There are a number of
different PET values, but the R-PET data in the Polymers table is [19.1, 6.3,
9.1, 4.9] and the distance between the paraquat and the PET is 4.1, inside the
radius and therefore a warning that PET would not be a good idea. To check out
the polymers in general, select paraquat in the solvents table then click
Polymers within the Polymers form.
Figure 1‑3 Selecting Paraquat from the main table then clicking Polymers
You will find that the other PET values
(such as Mylar PET) also have a Score (in this case, the RED number of the
paraquat) less than 1. Nearer the top are polymers such as PMMA and PVC ( both REDs~0.35).
Near the bottom of the table are the high RED polymers such as Polypropylene
and Polyethylene, so you could be confident of no diffusion of the weedkiller
through these bottles. If you think that the worry about dilute chemicals in
PET bottles is excessive, just think what happens if the lid is left off so
that the water evaporates and concentrates the chemical. What remains could be
potentially very active in getting through the PET.
Bio-polymers
We know that common polymers have land-fill
degradation times of 100’s of years. Bio-polymers can have degradation times of
months to a few years under the right conditions. But industries aren’t going
to shift easily to these new polymers. They have to know much more about them.
One key thing that’s needed is an idea of their compatibilities with solvents,
plasticizers and other polymers. And the shortest route to identifying these is
via HSP. We use, for example, data from the paper A. Agrawal et al. Constrained nonlinear optimization for
solubility parameters of poly(lacticacid) and poly(glycolic
acid)—validation and comparison, Polymer, 45 (2004) 8603–8612.
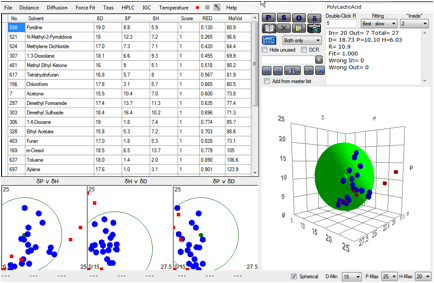
Figure 1‑4 Using file PolyLacticAcid
Armed with this correlation, [18.7, 10.1, 6.0,
10.0] and with the solvents sorted by their RED number, it’s easy to determine
that a high-boiler such as NMP or a low boiler such as 1,3 Dioxolane would be a
good choice of solvent depending on the type of application. If solvent data
hadn’t been available, the estimation from the Stefanis-Panayiotou DIY
calculator (see the chapter on DIY HSP) gives a creditable [17.2, 9.8, 8.1],
which would have been given a reasonable choice of practical solvents. One of
us (Abbott) has written a review (Poly(lactic
acid): Synthesis, Structure, Properties, Processing and Applications, Eds.
R. Auras; L-T, Lim; S.E.M. Selke, H. Tsuji, Wiley, 2010) on how HSP provide a
coherent framework for explaining many real-world issues confronting this
relatively novel polymer – such as choice of plasticizer, filler
dispersion/compatibility and odour/fragrance permeability.
Pervaporation
One way to remove contaminants from water
is to apply high pressure to the contaminated liquid as it passes through a
tube surrounded by a polymer membrane through which the contaminant can diffuse
but the water cannot. After the permeation
through the membrane the solvent then evaporates,
hence the term pervaporation. A
specific example comes from Professor Yoram Cohen’s group at UCLA. They wished
to remove tetrachloroethylene and chloroform contaminants from water. The
technological innovations in producing a robust membrane supported on a ceramic
tube need not concern us here. The key was the choice of the polymer for the
membrane.
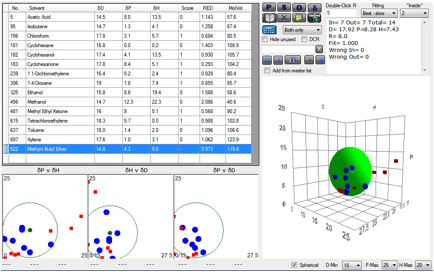
Figure 1‑5 Pervaporation through PVA
The polymer used was PVA
(polyvinylacetate). As the data show, both chloroform and TCE have a RED <1
and are therefore likely to be able to pass through the membrane. Indeed, their
pervaporation experiments showed good pervaporation removal of the two
contaminants in their system. Note the final solvent in the list. It is not
included in the plot but its RED number shows that it too should be removable
by pervaporation. Indeed, in a later paper, Cohen’s group showed good speed and
specificity for removal of methyl-t-butyl ether which is a modern-day
contaminant in groundwater because of its use as an octane enhancer in
petrol/gasoline as a “safe” replacement for lead tetraethyl.
Soil
chemicals
It’s often important to know whether a
chemical will tend to stay attached to soil particles or prefer to partition
into the water trickling through the soil. The soil-water partition coefficient
(relative to organic carbon), Koc, has been measured for many
compounds and a number of techniques for estimating Koc have been
suggested. A paper by Prof Schüürmann’s group at Leipzig has provided
an overview of the various datasets available and compared their own methods to
those in the literature: G Schüürmann, R-U
Ebert, R Kühne, Prediction of the
Sorption of Organic Compounds into Soil Organic Matter from Molecular Structure
Environ. Sci. Technol. 2006, 40, 7005-7011.
Using the CAS numbers from their data table
it was straightforward to identify 80 chemicals within our own dataset for
which there was Koc data. By using the simple formula (another
variation on the χ parameter form)
Equ. 1‑1 log Koc =-0.327 +
0.0008 * MWt * (4 * (δDc-δDs)2 + (δPc-δPs)2
+ (δHc-δHs)2) ½
a respectable R² of 0.835 was obtained.
In this equation, “c” is the chemical and “s” is the soil. δDs, δPs
and δHs were obtained by fitting as [13.8, 20.8, 9.2].
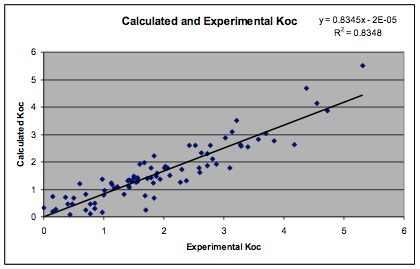
Figure 1‑6 Calculation of soil sorption
This quick excursion into soil science is
not intended to prove that HSP are good predictors of partitioning into soil,
nor is any technical explanation being offered - it would need a much more
extensive analysis. But it is interesting that once again the same basic HSP
equation seems to work adequately when applied to such a complex problem. Note
that the fit uses Molecular Weight and not Molar Volume. When the latter is
used, the fit is less good.
Radon
Homeowners in some parts of the world are
unlucky. Their houses are built on granitic rocks that contain a lot of radon
from natural radioactive decay. It is therefore desirable to put a barrier film
underneath a house to inhibit the ingress of radon. Can HSP help with the
problem? Surprisingly the answer is “yes”. The starting point for thinking
through the problem is the well-known fact that EVOH is an excellent oxygen
barrier. Why is this very modest polymer such a good oxygen barrier? Nothing
about its polymer structure makes it an obvious block to oxygen. And why is
something like polyethylene such a poor oxygen barrier? As the Diffusion
chapter shows, permeation depends on diffusivity (which depends on polymer
structure) and on solubility. And this is why EVOH is so good. If you load Gases.hsd
you find the following table:
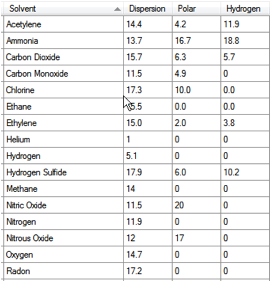
Figure 1‑7 Gas HSP from Gases.hsd
The HSP of oxygen are [14.7, 0, 0]. The HSP
distance from polyethylene (PE) is a modest 5, inside the sphere. The distance
from EVOH is a massive 20. No wonder that EVOH is such a good oxygen permeation
barrier. The table also includes Radon at [17.2, 0, 0]. The distance from EVOH
is 17.5 and from PE is 3. There is a literal take-home message from this: don’t
protect your house from Radon with PE film. However, EVOH is a useless barrier
for water as it readily swells. So you can’t protect your home with a pure EVOH
barrier – you need a water barrier to protect the EVOH. Try a PE-EVOH-PE
laminate as the HSP calculations are totally opposite – the distance of PE
from water is >20 so the water solubility, and hence permeability is very
low. HSP have one more thing to contribute. That laminate is unlikely to exist because
the distance between EVOH and PE is so large. Therefore you’ll need a tie layer
of intermediate HSP.
It’s also a good idea to load Gases.sof
into the Solvent Optimizer, enter the HSP of your polymer as the Target then
click on the Sol. Graph button to see the relative solubilities of the
different gases in your polymer. It gives you a good overview of the extent to
which different gases are likely to want to permeate through your polymer.
Rational
substitution and Read Across
It is very difficult to substitute one
molecule with another or do a full comparison of two molecules in order to
“Read Across” the health and safety values from one known compound to an
unknown one. In HSPiP we bring together many of the strands of this and other
chapters to make such comparisons powerful and easy. By entering the SMILES
values of two chemicals, the Y-MB method provides a whole range of predicted
values. Of course comparison of HSP is vital and the HSP Distance is
automatically provided. But as Y-MB is based on functional groups, a
“Functional Group Distance” is provided which, naturally, is larger the more
differences there in functional groups. Important values such as vapour
pressure and RER (Relative Evaporation Rate) are key for those interested in
VOCs, along with the MIR and OH values for VOC reactivities. Various partition
coefficients are estimated: log Kow (octanol/water), log Koc (soil absorbtion)
and BCF (Bio Concentration Factor). Remember that the RER calculated is based
on nBuAc=100. If you need the ether-based system then the formula is
RER-based-on-nBuAc=12/Ether-based-system
(or 1200 if ether is 1 in its system).
Armed with all this information, HSPiP
users are in much better shape to make informed choices affecting health,
safety and the environment. See the Predictions chapter for more information on
each of the predicted parameters.
E-Book contents | HSP User's Forum