Hansen Solubility Parameters in Practice (HSPiP) e-Book Contents
(How to buy HSPiP)
Chapter 15 Skin deep (HSP and Skin Absorption)
It’s really rather important to know if a
chemical will or will not penetrate into the skin. It can be a matter of health
& safety or it can be a matter of beauty (even if that is only skin deep).
With strong pressure to reducing the amount
of testing on animals, it’s important to find alternative ways to screen
chemicals for their ability to penetrate the skin. Having a high scientific
confidence that a chemical can or cannot thermodynamically penetrate the skin
can reduce the need to test. If you are confident that it cannot penetrate then
it is unlikely to be a useful beauty aid, but it is equally unlikely to pose a
general safety hazard by skin penetration. This approach is not enough on its
own to guarantee efficacy or safety, but it is a very good starting point.
One possible approach is to find directly
the HSP of skin. Clearly this is impossible as skin is a complex
multi-component system. But a reasonable starting point for such measurements
is abundantly available – psoriasis scales. (see Hansen, C.M., and
Andersen, B.H., The Affinities of Organic
Solvents in Biological Systems, Amer. Ind. Hyg. Assoc. J., 49, No. 6,
301-308 (1988)). The usual multi-solvent test, using swelling/non-swelling as a
criterion, gives δP & δH values (9.3, 15.6) which are credible and a δD
value (>25) which is not.
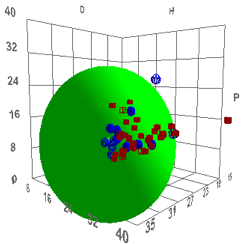
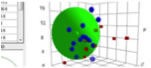
Figure 1‑1 Using file Psoriasis
The reason for this large D and large radius
is unknown, but we present the data for you to reach your own conclusions.
The next approach is to do permeation tests
on real skin samples. (See Ursin, C., Hansen, C.M., Van Dyk, J.W., Jensen,
P.O., Christensen, I.J., and Ebbehoej, J., Permeability
of Commercial Solvents through Living Human Skin, American Industrial
Hygiene Association Journal, Vol. 56, 651-660 (1995)). By choosing a suitable
range of solvents it could be possible to see if there is a sensible
correlation with HSP, even though we know that permeation rates also depend on molar
volume and shape. Such a correlation is shown below, with the definition of
“good” solvents being those having rapid permeation rates (they are Dimethyl
sulfoxide (DMSO), Dimethyl formamide (DMF), Dimethyl acetamide (DNAc), and
N-methyl-2-pyrrolidinone (NMP)), which, for humans, is “bad”:
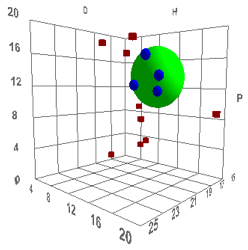
Figure 1‑2 Using file Skin
The values are [17.6, 13.5, 10.2, 4.3]
which are reasonable. The Radius is a rather small 4 which means that rapid skin
penetration is quite restricted – which seems to be another triumph for
evolution as a large R would make us rather too susceptible to harm via our
skin.
Suppose you wanted a reasonable polymer
model for skin penetration. Clearly you need a polymer with HSP close to that
value. In the software you can find one easily. Enter these parameters as the
final row in the Polymers list. Now double-click on that row. The software
finds the optimum match (best mutual overlap of the two radii) between Skin and
the other polymers. High in that match is polyurethane. So if you want to test
chemicals for skin penetration, have a go first with a polyurethane. Not
surprisingly, the test industry has found that polyurethane can be a useful
test substitute for skin. One example involved tests of adhesion to skin.
Testers preferred to have the adhesive stick to the polyurethane rather than
pull out the hairs from their skin.
Now let’s set ourselves the target of
protecting our skin from a solvent or chemical which from HSP criteria would be
likely to permeate and which from chemical intuition might be likely to be
harmful. By loading the full Solvent Sphere Data set and then entering the Skin
parameters as an additional row, the double-click trick gives a list of
chemicals that match skin closely. From that list, something like Ethyl
Isothiocyanate sounds like something you wouldn’t want to get into you via your
skin. Select that row.
Now go to the Polymer form and click the
Polymer button. This automatically finds the best match to the selected solvent. Polyurethanes are near the top
so they should not be used for
protection as they afford little added protection against chemicals, even
though comfort may be at a maximum. Now go to the bottom of the table to find the worst
match. Of the practical polymers that can be used for gloves there’s no
surprise to find that simple PE or PP gloves should be more than adequate to
protect you from this chemical, though they are often too stiff for comfort and
use. The ubiquitous Nitrile glove is also in this region.
Whilst we’re on the subject of gloves,
there’s an interesting data set which seems, at first sight, to undermine HSP
thinking on permeability. Here is the entire data set for 1hr breakthrough
times for Neoprene.
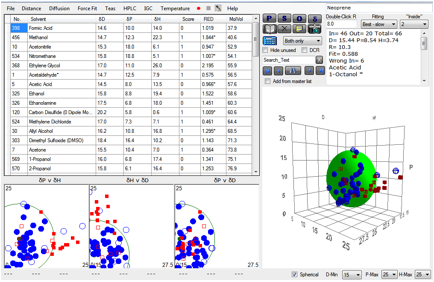
Figure 1‑3 A mindless correlation with Neoprene gives very bad results
The fit is awful and out of 66 solvents, 13
of them are “wrong”. So does this mean that HSP are useless?
Any scientific tool used without thought
can lead you astray. Arguably the bad fit above is a mindless use of HSP. Because
this correlation is based on breakthrough times which in turn depend on
diffusion coefficients, it’s obvious that molar volume must play an effect. In
this case, Kinetics must be significant, whereas HSP, as stated at the start,
assumes pure Thermodynamics.
So let’s try to exclude gross kinetic
effects from the calculation. Let’s exclude all very small molecules, say below
a molar volume of 70. And let’s exclude all very large molecules, say, above a
molar volume of 200. What do we then find?
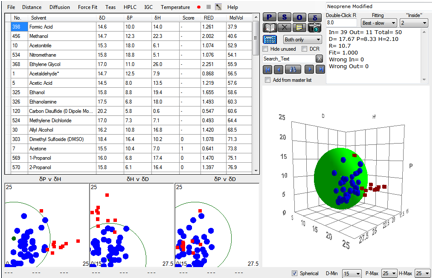
Figure 1‑4 A fit using more intelligence over molar volume effects
Now we get a perfect fit with no “wrong” solvents.
It’s probable that this is a pretty good set of HSP for Neoprene. But how valid
is what we’ve just done?
Only you can decide according to your own
application. Fortunately, HSPiP allows you to play “what ifs”. If you happen to
know that there is a very good reason for excluding methanol, but not the other
small molar volume molecules, you can try another fit. Or, as it turns out, the
real problem is the apparent slow diffusion of the largest molecules within the
film. Excluding those, on the reasonable grounds that the lack of permeability
was a size effect, gives a value not too different from the one above.
So using HSP involves some judgement by the
user. But that’s no bad thing and at least one’s judgements, as in the above
“good” fit, are made explicit. And there is a really important point that
should be emphasised. If a large solvent has a RED>1 you can be reasonably
certain that it will not permeate. If a small solvent has a RED<1 you can be
reasonably certain that it will permeate. A small solvent with a RED>1 is
problematical, but you would be wise to assume that it will get through. A
large solvent with a RED<1 is likely to permeate if you give it a longer
exposure time, so if you are serious about glove protection you would be
cautious about such solvents. In other words, even though we have admitted some
margin of error, there are still quite a lot of things you can conclude with
some degree of certainty. And as ever, consider the alternative. If you didn’t
have the HSP approach, how would you be able to form any sort of scientific judgement?
We are always on the lookout for
independent checks on HSP ideas. We were therefore very grateful to Martin Barratt,
formerly of Unilever, for allowing us to attempt to reinterpret his data on
skin irritancy published M.D. Barratt, Quantitative
Structure-Activity Relationships for Skin Irritation and Corrosivity of Neutral
and Electrophilic Organic Chemicals, Toxicology in Vitro, 10, 247-256, 1996.
A range of chemicals was classed as either Irritant (1) or non-Irritant (0).
The author (who was interested in QSAR interpretations of the data) admits that
the data themselves are not perfect as they come from a variety of sources, so
from the start we would not expect a great fit. And our calculations of the HSP
of many of the molecules cannot be expected to be highly accurate. Nonetheless,
a reasonable fit emerges giving values [17.3, 8.4, 7.7, 5] not too far from those
of the skin permeability test [17.6, 13.5, 10.2, 4.3].
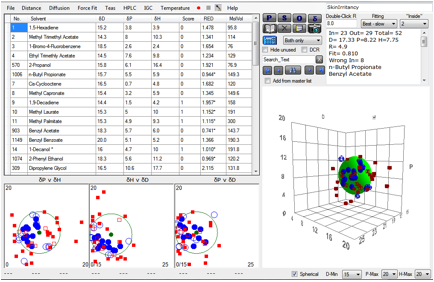
Figure 1‑5 A correlation with skin irritancy
We confidently predict that with some
larger, more self-consistent data sets on both skin permeability and skin
irritancy, better fits and better matches will be found. If such data are
produced we will be happy to use it in future editions of this book whether our
prediction is proved right or wrong.
We might also suggest the inclusion of
solvents with high polar parameters, such as those used in the skin permeation
study reported above. Highly polar solvents are not found in the above data
set, a fact that puts a bias toward a correlation with a lower polar parameter.
Our suspicion is that these would permeate/irritate based on the skin
permeability correlation presented above. If these were included in the
irritancy data, the result would presumably be a higher polar parameter, a
situation which would give even better agreement with the permeation
correlation.
We have to add a standard disclaimer her. “As
this book is a general guide to HSP and is not written by health and safety
experts please be aware that it is your responsibility to check that any result
you reach from HSP correlations or using the HSPiP software is only intended as
guidance and cannot substitute for detailed health & safety evaluations for
your particular cases.”
The
lipid-only bricks and mortar myth
The famous Potts and Guy correlation
between skin permeability coefficient and LogKow (the octanol/water partition
coefficient) + Molecular Weight has produced conclusions entirely opposite to
the ones above. It seems self-evident to many in the skin permeation community
that chemicals pass through the lipid layer, with the corneocytes being mere
passive bricks.
It is slowly becoming clear that this
lipid-only route is a myth. This is not to criticise the Potts and Guy paper.
It’s simply that it’s quite straightforward to produce a similar graph
(discussed below) “proving” a strong correlation with water solubility. If this
graph had been published instead of the LogKow graph then a water-only myth
might have sprung up instead.
The truth is much more interesting than
either myth.
At the heart of the mythology is a split into
two different worlds. The first one, represented by the HSP work above (itself
driven by issues of chemical safety), is concerned with the migration of small
molecule liquids (e.g. solvents, acrylates…) into skin. These are often
presented to the skin as pure liquids and the fact that they often swell the
skin is good evidence that the skin really does have high values for δP and δH,
totally untypical of a lipid-only route.
The second world is one where the pharma
industry need to get large molecules to go through the skin. The permeation
rates are painfully small. “Permeation enhancers” are often used to speed
things up, giving, often, a factor of 2-5 in Jmax, the maximum flux.
The literature on permeation enhancers is highly confusing. Because the
lipid-only route is seen as objectively true, then lipophilic molecules should
be excellent enhancers. But by far the best enhancers are water, ethanol, DMSO,
NMP etc. Their enhancement is explained away as being pathological. Ethanol,
for example, is often said to be a “lipid extractor” which does the enhancement
by ripping out the lipids, allowing the permeant to go through a destroyed
skin. This happens to be nonsense. Ethanol is a useless lipid extractor, as you
would expect from its large HSP distance from typical lipids. Some classic
enhancers such as Azone have a lipid tail, but their HSP are not particularly
low. The terpenes can sometimes be good enhancers – and are seized on as
proof of the lipid route. But sadly the evidence shows that usually they are
pretty useless unless combined with other elements of the formulation such as
ethanol.
If you read the skin permeation literature
it is quite painful to see authors trying to explain results in crude terms
such as “lipophilic” or “hydrophilic”. The term lipophilic is a cause of much
confusion. A good way to think about it is to ask “What is the opposite to
lipophilic?” A typical answer is “Hydrophilic”. But next ask “What is the
opposite to hydrophilic?” The answer is ambiguous. It can be “Hydrophobic” or
it can be “Oleophilic”. What is missing from the discussion is the key fact
that octanol is not particularly hydrophobic – water is soluble to 20% in
octanol. The Potts and Guy correlation is not
with a Octane/Water partition coefficient which is a much stronger
hydrophobic/hydrophilic measure.
Another key fact often missing from the
debate is that the lipid bilayer contains ~25-30% cholesterol. The HSP of
cholesterol [20.4, 2.8, 9.4] mean that it insoluble in both ethanol and hexane,
but a 50:50 mix is not a bad solvent (though the δD match is bad). It
is really more comfortable in, say, chloroform or 1,4 dioxane than in any
typical “lipophilic” solvent. So the heart of the lipid bilayer itself is not
particularly lipophilic.
One clue to resolving this situation is
mentioned above. The terpenes often give good permeation enhancement when used
with drugs formulated in ethanol. It’s often difficult to untangle precise
quantities being used, but it turns out that many formulations contain
approximately equal quantities of terpene and ethanol. If you do a quick HSP
check, it’s no surprise to see that the HSP of the vehicle is close to that of
skin. In particular, the cyclic structures of the terpenes provide a boost to δD
necessary to get up to the skin value.
Once the skin permeation literature is
approached as an exercise in solubility a lot of things start to make sense.
The behaviour of many permeation enhancers looks a lot more explicable in this
light. But let’s go further. Let’s think through all those pharma molecules.
The Potts and Guy correlation is with
permeation coefficient. But we don’t actually care much about that coefficient.
Instead we are interested in Jmax, the maximum flux.
A paper by Sheree Cross’s group in the
University of Queensland provides a large dataset of Jmax values: Beatrice M.
Magnusson, Yuri G. Anissimov, Sheree E. Cross, and Michael S. Roberts, Molecular Size as the Main Determinant of
Solute Maximum Flux Across the Skin, The Journal Of Investigative
Dermatology, 122, 2004, 993 –999. We are grateful to Dr Cross for
providing us with the full dataset to do our own analysis. An important
sentence near the start of the paper neatly summarises our own view of the
misdirection caused by the emphasis on permeability coefficients: “In practice, it is the maximum flux (Jmax)
of a solute that is of most interest in determining the maximal dermal, toxic,
or systemic effect. Almost all studies concerned with predicting skin
permeability have focused on skin permeability coefficients from aqueous
solution.”
At first sight their title is discouraging.
It doesn’t mention solubility at all. But one of the key findings from the
paper is that LogKow is not a useful
predictor. Our own plot of the full dataset shows a slightly negative bias with
an r2 of 0.09
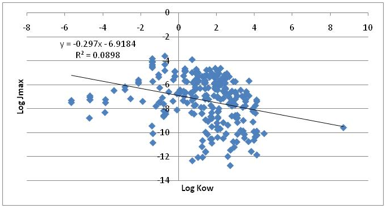
Figure 1‑6 The non-correlation between Jmax and LogKow
One plot which shows an interesting
correlation (but nowhere near as good as the molecular size which they rightly
concluded was the strongest single correlation) show Jmax versus
LogS, the water solubility.
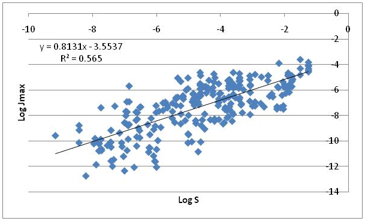
Figure 1‑7 Jmax correlates much better with water solubility!
The more water soluble the compound, the
higher the Jmax! This is the plot we mentioned earlier which could have
launched an alternative (and equally mythological) “hydrophilic only” skin
permeability hypothesis.
Dr Cross’s team were able to improve their
correlation somewhat by including melting point. Why should this be so? Because
melting point, as discussed in detail in the Predictions chapter, has a major
influence on solubility.
Although fitting large data sets like this
one is fraught with dangers, it seems to us that the most sensible way to look
at the data is by saying that Jmax is simply Solubility * Diffusion
Coefficient/Skin_Thickness. We can’t do anything about skin thickness so we
should focus on the other two factors. We know that Diffusion Coefficient
depends on molecular shape, for which Molar Volume is the best surrogate
approximation. That will explain the big theme of Cross’ paper. Solubility can
be predicted from first principles by the following equation:
Equ. 1‑1 ln(Solubility)= -C + E –A - H
where C is a term based on the melting
point (and is 0 for a liquid), E is the “combinatorial entropy” term which we
can ignore given the margin of error in all these data, A is an Activity
Coefficient term and H is a Hydrophobic effect term when considering solutions
in water and alcohols. This too can be ignored in this simple analysis.
The C term can be estimated directly from
the melting point using the Yalkowsky simplified expression:
Equ. 1‑2 C = -0.023*(Tm –T)
(The pre-factor of -0.023 comes from a very
recent Yalkowsky paper though it is quoted there as -0.01 as the paper uses Log10
instead of our Ln)
A can be estimated by the HSP distance
between the chemical and skin.
We can therefore simply estimate Solubility
in the (outer layer of the) skin and also use a simple power-law dependence of
Diffusion Coefficient based on the molar volume. That’s quite a few fitting
parameters, but here’s the fit:
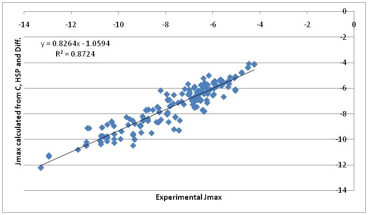
Figure 1‑8 A “first principles” fit to Jmax. Much more encouraging. Note that
the previous correlation with water solubility is mostly because water
solubility contains a large element of the “crystal” term.
That’s not a bad fit given such crude
approximations. Inspection of the individual components of the fit show the
following:
·
A power of 0.5 describes the
molar volume effect on diffusivity
·
A “skin” value of [17, 8, 8]
best provides the HSP term
·
The Crystal and Diffusion terms
fight for dominance in a manner that makes intuitive sense from the
calculation. In other words, for each molecule we can rationally decide which
component is most important in deciding the Jmax.
·
The HSP activity coefficient
correction is often small because many pharma molecules tend to be in the
region of [17, 8, 8] (not surprisingly because they have to be generally compatible
with the biological system). But the influence can be decisive for the
non-pharma chemicals of concern to the general skin permeation community or
those concerned with cosmetics which use large concentrations of relatively
simple/small molecules.
The fact that HSP don’t make dramatic
differences across the log-log plot does not
mean that HSP can be ignored. Remember that permeation enhancers tend to
deliver factors of 2-5 in enhancement. These are trivial in a log-log plot but
can make all the difference for a real drug. Because the crystalline
(melting-point) term can be so significant, it’s not surprising that HSP cannot
make a big difference for big pharma molecules. But by making sure that the
vehicle (e.g. 50:50 ethanol:terpene) matches both the skin and the pharma
molecule, the all-important factors of 2-5 can come in to play.
The HSPiP diffusion modeller can readily
simulate all these effects. In particular there are two competing issues. The
first is concentration dependent diffusion coefficients in the outer layers of
the skin. The more, say, ethanol/terpene there is, the higher the diffusion
coefficient. The second relates to the fact that the permeation enhancers
themselves get depleted across the skin. This reverse gradient can be approximated
in the modeller. Here is a typical example modelling some real skin diffusion
data and providing a quite satisfactory estimate of 21 minutes “lag time” (a
key parameter in many skin studies) from the magenta extrapolation of the red flux
curve.
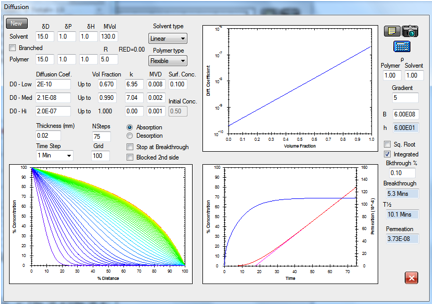
Figure 1‑9 The diffusion modeller coping both with concentration dependent
diffusion and a reverse gradient, whilst providing a classic “lag time” fit to
the integrated flux.
To remove all doubt, we are not saying that the above correlation
proves that the solubility/diffusion approach is the best way forward. But we are saying that the LogKow seems to have
produced only a confused literature that is focussing on the wrong parameter
(permeability coefficient) rather than the right one (Jmax). And we
are not claiming that HSP are
dominant in skin permeability of pharma compounds. But we are saying that the HSP provide key insights into the modest
effects of skin permeation enhancers and provide a coherent, numerical language
for thinking through the effects of the mixtures of components generally found
in skin formulations such as ethanol/terpene mixes and in liquid-based
formulations found in cosmetics, fragrances etc.
E-Book contents | HSP User's Forum