HSP Application note #5
Retention time of HPLC calculated by Hansen Solubility Parameter (HSP)2009.8.18
HSPiP Team Senior Developer, Dr. Hiroshi Yamamoto
Retention time for HPLC and Hansen Solubility Parameter (HSP)
Can you predict the Retention times of HPLC for certain compounds?
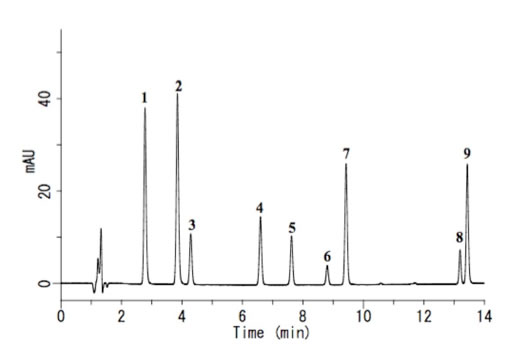
For example, if you analyze 9 antioxidants with HPLC, you will get chromatography chart like below.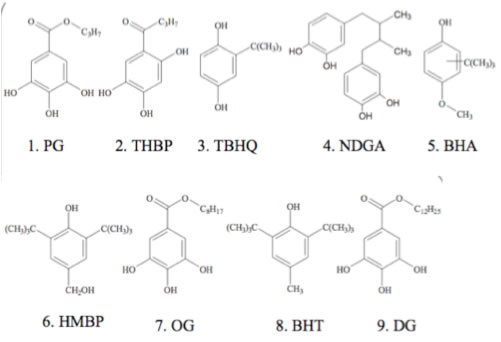
You can assign each peak if you analyze standard chemicals with HPLC. But do you know why TBHQ(#3) and BHA(#5) are so apart?
We believe that retention time difference is governed by “Solubility”.
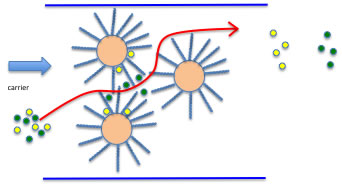
The most popular column for HPLC is ODS column and this column contains Silica-gel covered by Octadecyl. When we insert some chemicals into this column, some chemicals dissolve to octadecyl alkyl chain deeply and some do not. So, highly interacted chemicals will delay to elute. Or some chemicals which are very easily dissolve to carrier liquid, elute very early.
Then how can we evaluate this “Solubility” to fixed phase or moving phase?
Have you ever heard of “Solubility Parameter”?
It is very popular for Polymer research area, but maybe not so much in Analytical Chemistry area. The basic concept of solubility parameter was developed by Hildebrand and Scott. (“The Solubility of None-electrolytes.1964)
The free energy of mixing is written as
ΔG=ΔH-ΔTS
and if ΔG is less than 0, at that time mixing will happen.
ΔH=φ1φ2V(σ1-σ2)2 φ:volume ratio、σ:SP value
The SP(solubility parameter) value was first appear in this scheme.
If the SP values are very near, the ΔH becomes 0, so ΔG becomes easily less than 0.
The concept of “likes dissolve likes” come from this idea.
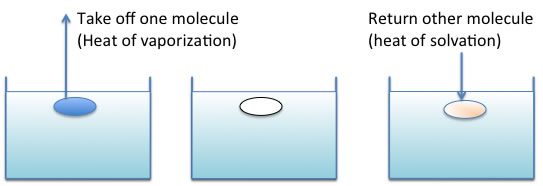
σ={(ΔH-RT)/V}0.5
A lot of σ are calculated from heat of vaporization and listed on handbook or database.
This Hildebrand SP value is very easy to get and very popular, but in practical works, it can not use. Because the similar Heat of vaporization of chemicals become same SP value even though chemical structure is so different.
Hansen Solubility Parameter (HSP)
Hansen divided this heat of vaporization energy into 3 parts.
δD : Dispersion energy
δP : Polarity energy
δH : Hydrogen bonding energy
And use this 3 parameter as Vectors, [dD, dP, dH].
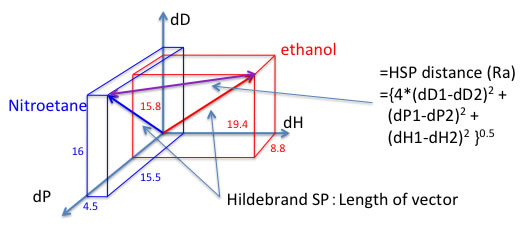
For example, ethanol and nitroethane have almost same Hildebrand SP value because heat of vaporization is almost same. But Hansen solubility parameter vectors are so different. And Hansen solubility theory is if the HSP distance is short, then it will dissolve. “Likes Vectors dissolve Likes Vectors”.
And you can calculate HSP distance with this scheme.
HSP distance(Ra)={4*(dD1-dD2)2 + (dP1-dP2)2 +(dH1-dH2)2 }0.5
We will analyze HPLC retention time with this Hansen solubility Parameter.
The first thing to do is get HSP value of chemicals. The HSP of solvents can be found on handbook or in the internet, but you can not find HSP of antioxidants.
In that case, we need to use HSPiP software which developed by professor Abbott and Dr. Hansen. In the HSPiP, there is one function named Y-MB to estimate HSP from molecular structure.
HSPiP(Hansen Solubility Parameters in Practice)The first edition of HSPiP that appeared in November, 2008, greatly enhanced the usefulness of the Hansen solubility parameters (HSP). The HSP values of over 1200++ chemicals and 500 polymers are provided in convenient electronic format and have been revised and updated using the latest data sources in the second edition (March, 2009). A third edition of the HSPiP appeared in March, 2010. There are now 10,000 compounds in the HSP file which also includes data on density, melting point, boiling point, critical parameters, Antoine constants and much more. The user is able to carry out many different sorts of optimisations of solubility, evaporation, diffusion, adhesion, create their own datasets (automatically if required) and explore the huge range of applications for HSP in coatings, paints, nanoparticles, cosmetics, pharma, organic photovoltaics and much more. The 3rd Edition v3.1 was released on 12 December 2010. Current users can upgrade free (now v3.1.09) by downloading the latest .msi installer from http://hansen-solubility.com The 4th Edition v4.0.x was released on 2 Jan. 2013. The Current users can upgrade with free charge. 2013.1.28 The Visual How to manual of HSPiP. You can understand what HSPiP can do. |
Y-MB Properties EstimationY-MB break Smiles into correspponding Functional Groups and Estimate various Properties. These estimation schemes are come from Pirika technologies.
Pirika JAVA Demo Applet calculate Properties. PirikaLight is available here. |
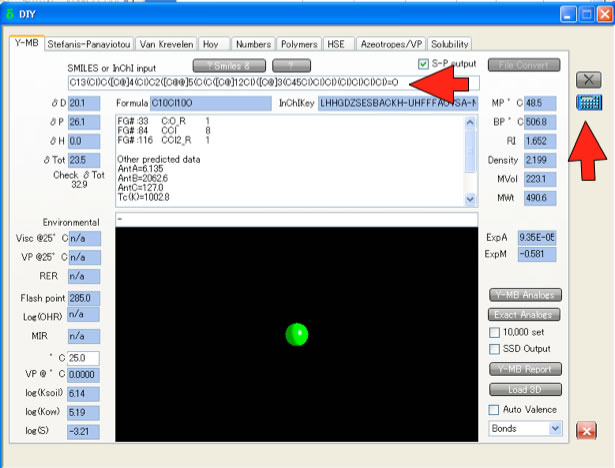
Run HSPiP and push σ button, then new window will open. Select Y-MB tab and input SMILES code for antioxidant.
Smiles(Simplified Molecular Input Line Entry Syntax) SMILES is a string obtained by printing the symbol nodes encountered in a depth-first tree traversal of a chemical graph. Pirika JAVA Demo Applet getting Smiles. Draw2Smiles is available here. |
Then push calculator button, Y-MB automatically break molecule to several functional groups, and calculate molecular properties and HSP. Please write down the σD, σP, σH and MVol values. It is good idea to prepare all the antioxidants smiles in spreadsheet, and write back calculated value for the further task. If you are not accustom to Smiles, you can get information in the internet. Most typical depict commercial software have the function of “Copy as Smiles” and some freeware can handle smiles. There are some web site where convert CAS number to Smiles.
The calculation results are summarize as below.
| name | CAS# | RT | dD | dP | dH | Volume | |
| PG | Propylgallate | 149-91-7 | 2.77 | 17.5 | 9.0 | 20.1 | 169.7 |
| THBP | 2,4,5-Trihydroxybutyrophenone | 1421-63-2 | 3.83 | 18.1 | 9.2 | 21.6 | 160.8 |
| BHA | Buthylated Hydroxyanisole | 25013-16-5 | 7.60 | 17.5 | 5.2 | 10.2 | 184.1 |
| HMBP | 4-Hydroxymethyl-2,6-di-tert-buthylphenol | 8.79 | 16.8 | 3.3 | 10.5 | 242.6 | |
| OG | Octyl gallate | 1034-01-1 | 9.45 | 17.2 | 6.6 | 14.2 | 252.9 |
| BHT | Buthylated hydroxytoluene | 128-37-0 | 13.19 | 16.5 | 2.1 | 6.6 | 244.3 |
| 2DG | Dodecy lgallate | 1166-52-5 | 13.46 | 17.0 | 5.7 | 11.8 | 318.8 |
| TBHQ | tert-Bubylhydroquinone | 1948-33-0 | 4.29 | 17.4 | 5.4 | 14.7 | 166.1 |
| NDGA | Nordihydroguaiareticacid | 500-38-9 | 6.59 | 18.7 | 5.8 | 17.4 | 264.1 |
Retention time (RT) are obtained by digitizer after scanned the HPLC chart. You can find several freeware to do that.
And determine Carrier Liquid HSP and Fixed Phase HSP. Hansen Solubility parameter case, you can get HSP of mixture solvents with addition of vectors. This HPLC elution liquids are MeOH/CH3CN/water/CH3COOH=0.2/0.2/0.57/0.03 so HSP of mixture become [15.27, 15.42, 30.196]. And we use Octadecane [16.4, 0, 0] as fixed Phase.
HSP distance(Ra)={4*(dD1-dD2)2 + (dP1-dP2)2 +(dH1-dH2)2 }0.5 eq. (1)
With eq.(1), we can calculate HSP distance from fixed phase to antioxidants.
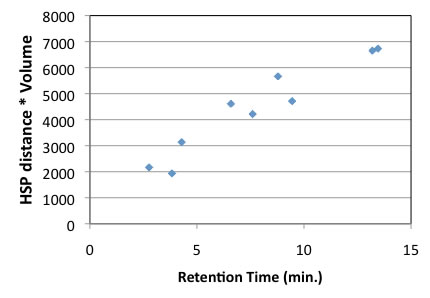
We got result as below.
It seems 2 lines. But the HSP distance from octadecane becomes long, retention time becomes short. When HSP distance become long, the direction of vectors or length of vectors are different.
In other word, the compounds hard to dissolve octadecane becomes short retention time.
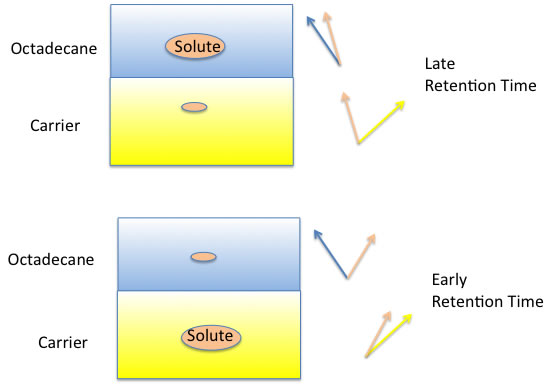
If the compounds include dodecyl or t-butyl group, the HSP of molecule become near to dodecane, and HSP distance become short, and easy to dissolve to fixed phase, so retention time become long.
Why there are 2 lines? Upper lines compounds contains 3 hydroxy groups, so prediction of HSP for multi hydroxy groups compounds may be very bad. Prof. Abbott and Hansen suggestion is to include molecular volume to HSP distance. So HSP distance is divided by mol volume and plot with retention time.
It becomes much better.
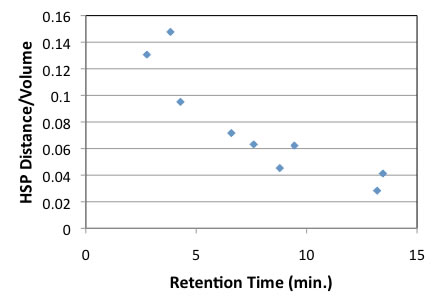
There are 2 exceptions, Octyl Gallate and Dodecyl Gallate. Other case, we can predict RT with HSP distance and molecular size.
Then let’s examine from the point of carrier solvents. It can say that shorter HSP distance from carrier solvents to antioxidants, becomes shorter retention time. The shorter HSP distance means good solvent. So, the HPLC result is governed by balance of solubility to Carrier solvent and solubility to fixed phase. So some compounds that are not easy to dissolve to fixed phase, but also that are not easy to dissolve carrier solvents, then it seems as exceptions.
With this HPLC experiment, the solvent change to MeOH/CH3CN=50/50 so I need to change carrier HSP, but for this result, I did not do that.
If our solvent theory is right, we can predict the solvent mixture that expand Retention time. 2:THBP[17.7, 8, 18.3] and 3:TBHQ[17.3, 7.2, 16] have very similar retention time. The fixed phase HSP is same , so we can change carrier solvent to expand 2 peaks.
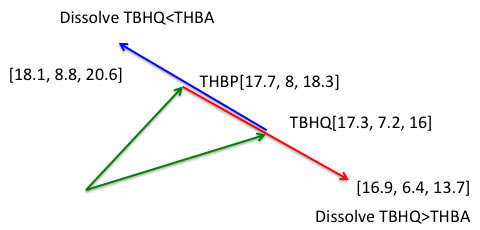
The basic concept is making maximum HSP distance effect. If we choose the solvent that HSP is [18.1, 8.8, 20.6] , Then it make THBP RT short because that solvent dissolve THBP much more compare to TBHQ. If we choose [16.9,6.4,13.7] solvent, that dissolve TBHQ much more and RT becomes short for TBHQ.
Then how we can design [18.1, 8.8, 20.6] or [16.9,6.4,13.7] solvent? If we use HSPiP and “Solvent optimizer” function, we can get the result within few second!
HSP will help you understanding HPLC so much.
Please refer to e-Book chapter 16 more details.
When I studied SEC(Size Exclusion Chromatography) analysis in the internet, I got Rohrschneider's polarity parameters.
| Name | Formula | SP | Rohrschneider polarity | Hcode |
| Acetic acid | CH3COOH | 12.4 |
6 |
5 |
| Acetone | CH3COCH3 | 9.4 |
5.1 |
7 |
| Acetonitrile | CH3CN | 11.8 |
5.8 |
10 |
| Carbon tetrachloride | CCl4 | 8.6 |
1.6 |
122 |
| Chloroform | CHCl3 | 9.3 |
4.1 |
156 |
| Cyclohexane | C6H12 | 8.2 |
-0.2 |
181 |
| Dimethylformamide | (CH3)2NOCH | 11.5 |
6.4 |
297 |
| Dimethylsulfoxide | (CH3)2SO | 12.8 |
7.2 |
303 |
| Dioxane | C4H8O2 | 9.8 |
4.8 |
306 |
| Ethanol | C2H5OH | 11.2 |
4.3 |
325 |
| Ethyl acetate | CH3COOC2H5 | 8.6 |
4.4 |
328 |
| Dichloroethane | CH2ClCH2Cl | 9.7 |
3.5 |
367 |
| Ethylene glycol | HOCH2CH2OH | 14.7 |
6.9 |
368 |
| n-Hexane | CH3(CH)3 | 7.3 |
0.1 |
417 |
| Isopropyl ether | (CH3)2CHOCH(CH3)2 | 7 |
2.4 |
443 |
| Methanol | CH3OH | 12.9 |
5.1 |
456 |
| Methyl ethyl ketone | CH3COC2H5 | - |
4.7 |
481 |
| Dichloromethane | CH2Cl2 | 9.6 |
3.1 |
524 |
| n-Propanol | CH3CH2CH2OH | - |
4 |
569 |
| Isopropyl alcohol | CH3CH(OH)CH3 | 10.2 |
3.9 |
570 |
| THF | C4H8O | 9.1 |
4 |
617 |
| Toluene | C6H5CH3 | 8.9 |
2.4 |
637 |
| Water | H2O | 21 |
10.2 |
696 |
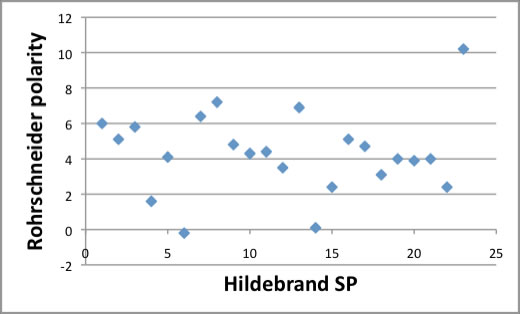
There is no relationship between Rohrschneider polarity and Hildebrand SP.
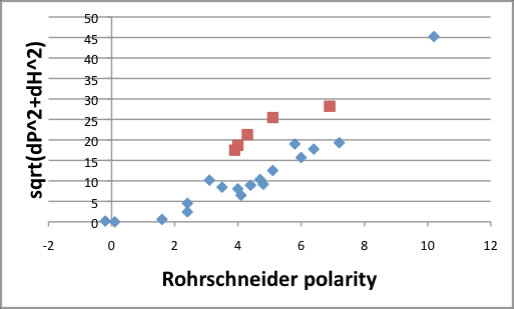
But Hansen solubility parameters (HSP) , especially, dP and dH terms have strong correlation with Rohrschneider polarity. Overall, sqrt(dP^2+dH^2) index is the best fit to Rohrschneider polarity. Alcohol (red square) make another line, but other compounds seems OK.
You can refer how to use this Index (Outside Pirika link).
2011.2.22
I got many questions about "How to do these calculation" from HSPiP user. So I summarize how to. At first you need to prepare Smiles structure.
Smiles(Simplified Molecular Input Line Entry Syntax) SMILES is a string obtained by printing the symbol nodes encountered in a depth-first tree traversal of a chemical graph. Pirika JAVA Demo Applet getting Smiles. Draw2Smiles is available here. |
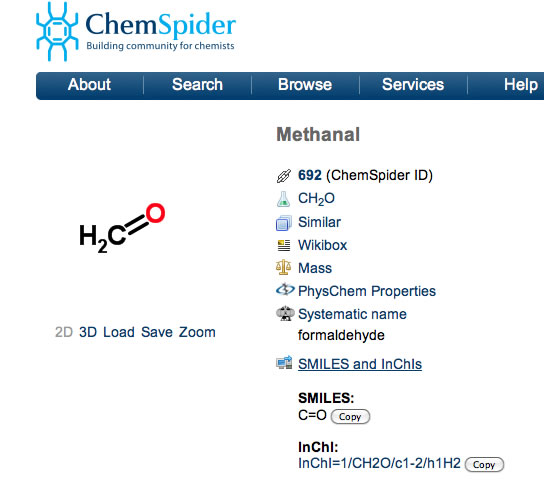
If you visit ChemSpide Home page You can get Smiles from chemical name or CAS#, and copy that smiles then make table.
You can easily make table like below.
| name | CAS# | Smiles | |
| PG | Propylgallate | 121-79-9 | O=C(C1=CC(=C(C(=C1)O)O)O)OCCC |
| THBP | 2,4,5-Trihydroxybutyrophenone | 1421-63-2 | CCCC(=O)C1=C(C=C(C(=C1)O)O)O |
| BHA | Buthylated Hydroxyanisole | 25013-16-5 | OC1=CC=C(C=C1C(C)(C)C)OC |
| HMBP | 4-Hydroxymethyl-2,6-di-tert-buthylphenol | 88-26-6 | OC1=C(C(C)(C)C)C=C(C=C1C(C)(C)C)CO |
| OG | Octyl gallate | 1034-01-1 | OC(=C(C(=C1)O)O)C=C1C(=O)OCCCCCCCC |
| BHT | Buthylated hydroxytoluene | 128-37-0 | CC(C=C1C(C)(C)C)=CC(C(C)(C)C)=C1O |
| DG | Dodecy lgallate | 1166-52-5 | OC(=C(C(=C1)O)O)C=C1C(=O)OCCCCCCCCCCCC |
| TBHQ | tert-Bubylhydroquinone | 1948-33-0 | OC(C=C1C(C)(C)C)=CC=C1O |
| NDGA | Nordihydroguaiareticacid | 500-38-9 | Oc1ccc(cc1O)CC(C)C(C)Cc2ccc(O)c(O)c2 |
Then run HSPiP program and push sigma button at the main panel. Select Y-MB tab. Then paste Smiles into text field and push calculate button. You will get HSP[dD, dP, dH] value and Molecular Volume.
If you want to do this with batch system, please refer to DB import article.
| RT | dD | dP | dH | Vol | |
| PG | 2.8 | 17.5 | 6 | 21 | 166.6 |
| THBP | 3.8 | 17.7 | 8 | 18.3 | 157.7 |
| BHA | 7.6 | 17.4 | 7 | 10.8 | 182 |
| HMBP | 8.8 | 16.8 | 6 | 9 | 240.3 |
| OG | 9.4 | 16.9 | 3 | 18.1 | 249.9 |
| BHT | 13.2 | 16.61 | 3.28 | 6.09 | 241.85 |
| DG | 13.5 | 16.6 | 2.9 | 15.7 | 316 |
| TBHQ | 4.3 | 17.3 | 7.2 | 16 | 161.5 |
| NDGA | 6.6 | 18.8 | 6.1 | 17.4 | 257.1 |
You can prepare table like above.
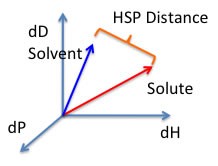
HSP DistanceTo calculate the distance (Ra) between Hansen parameters in Hansen space the following formula is used:
HSP distance(Ra)={4*(dD1-dD2)2 + (dP1-dP2)2 +(dH1-dH2)2 }0.5 |
Then you need to calculate HSP distance from Octadecane [16.4, 0, 0] to solutes.
If the distance is short, that solute is easily dissolve to Octadecane, and become large retention time.
| RT | sqrt(4*(dD-16.4)^2+(dP-0)^2+(dH-0)^2) | Vol | |
| PG | 2.8 | 21.95 |
166.6 |
| THBP | 3.8 | 20.14 |
157.7 |
| BHA | 7.6 | 13.02 |
182 |
| HMBP | 8.8 | 10.85 |
240.3 |
| OG | 9.4 | 18.37 |
249.9 |
| BHT | 13.2 | 6.93 |
241.85 |
| DG | 13.5 | 15.97 |
316 |
| TBHQ | 4.3 | 17.64 |
161.5 |
| NDGA | 6.6 | 19.05 |
257.1 |
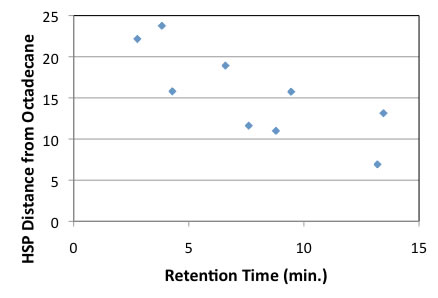
finally, you can get table like below.
| RT | Dis/Vol | |
| PG | 2.8 | 0.132 |
| THBP | 3.8 | 0.128 |
| BHA | 7.6 | 0.072 |
| HMBP | 8.8 | 0.045 |
| OG | 9.4 | 0.074 |
| BHT | 13.2 | 0.029 |
| DG | 13.5 | 0.051 |
| TBHQ | 4.3 | 0.109 |
| NDGA | 6.6 | 0.074 |
If you plot this result, you can get chart like below.
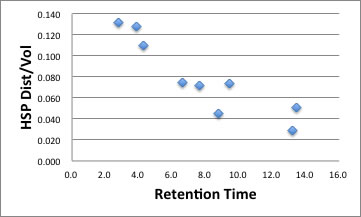
You need only Smiles structure and HSPiP to get this chart.
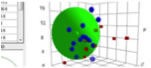
Drag=Rotate, Drag+Shift=Larger/Smaller, Drag+Alt or Command(Window key)=Translate.
If you are using HTML5 enable browser such as Chrome, Safari or FireFox (IE9 is out of support), you will see the Canvas. If you pick solvent, solvent name will appear.
The green large sphere show Octadecane. if the solute are near to Green Sphere, it easily dissolve into fixed phase, and Retention time become long. The larger molecule also have long retention time. The functional group introduced position also affect RT.
If you draw several molecules and calculate each molecules' properties, program will simulate Retention Time (RT) of OSD column for HPLC. If you want to know how to draw molecules, please refer to PowerTools applications. I have full version of this HPLC RT simulation program at PowerTools+ Applications.
Retention time for HPLC
HPLC analysis of PAHs
HPLC analysis of medicine of Epilepsia
HPLC analysis of Anti-oxidant.
HPLC analysis of Sulfa Drugs.
HPLC analysis of Plasticizer
HPLC analysis of Carboxylic acid
Please refer to liquid-liquid extraction article if you want to know the mechanism.