How to evaluate the “human skin irritation patch test” with HSP?
If you plot the solvents that dissolve the polymer and the solvents that do not dissolve the polymer in Hansen space, the group of solvents that dissolve the polymer forms a sphere, which is called the Hansen sphere of dissolution.
Plotting the results of the skin irritation is troubling.
Apparently, I can’t see the dissolving sphere.
Hansen Solubility Parameters (HSP) of more than 4 dimensions cannot be plotted in 3 dimensions. By plotting the first to third principal components of the principal component analysis in 3D, we can plot the HSP of more than 4 dimensions in 3D space.
In this article, I will show the results of using not only HSP related indexes, but also the index that incorporates molecular volume into HSP.
The original paper is by Yuichi Kozuki, Shiseido in J. Soc. Cosmet. Chem. Jpn. Vol. 43(4), No. 4 2009 pp254-259. He has created a model to predict the results of patch tests with In Silico. He uses the results of molecular orbital calculations as descriptors.
The basic stance of our HSP research group is that if it does not dissolve in the skin in the first place, it will not cause irritation. Therefore, we think that HSP is important. However, we know that no matter how close the HSP is and how high the solubility is, if the molecule is very large, it will not dissolve. For example, for plasticizers of polymers, the HSP is very similar to that of the polymer and the molecular weight is large. This is because it is important that they do not bleed out and get trapped in the polymer’s weave. On the other hand, if you try to dissolve the polymer with such a plasticizer, the molecule is too large to enter the polymer, so it may not dissolve even if the HSP is the same.
Let’s think about this in a variety of ways using the principal component analysis method in practice.。
The data will look like the above. If you are interested, you can try it yourself.
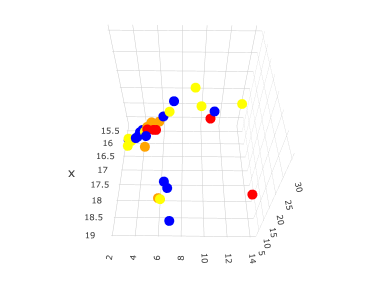
If you plot this data, you will get the following 3D graph.
x: HSP δD
y: HSP δP
z: HSP δH
The colors are changed according to the range of the positive rate (PR).
Blue PR=0
Yellow 1<PR<10
Orange 10<PR<30
Red PR>30
Looking at this graph alone, it appears that the HSPs with very high positive rate (PR) (red mark) are distributed in three locations in the Hansen space. This in itself is not surprising since there are about three known routes of skin penetration.
Compounds with HSP in the region where there is a lot of red and orange may need attention.
If we look at alcohols alone, for example, alcohols with large or small molecular weight have low PR, with Hexanol being the highest followed by Octanol.
If we assume that this is due to molecular volume, we can create a 4-dimensional vector table by adding molecular volume to the 3-dimensional HSP. If we analyze this table by principal component analysis, 96% of the HSP can be expressed by the third principal component.
A 3D plot of the 1st to 3rd principal components looks like this
Then all the solvents ride on one straight line in 3D space. One end of the line is the one with high PR and the other end is the one with low PR.
The exception is isopropanol (blue), which is near the one with large PR. Ethanol and butanol, which are yellow, have similar molecular sizes and HSP, so they are plotted in similar positions. Conversely, Isopropyl myristate (yellow) is near the opposite end, which is almost the same size and HSP as Isopropyl palmitate, so this is the result.
The orange and red regions solidify around the middle, but it is a little hard to see because blue also comes in.
So, we perform a principal component analysis with 8 vectors: dDvdw, dDfg, dP, dHAcid, dHbase, ED, EA, and Volume, and plot the 1st-3rd principal components in 3D.
Then, I got a straight line for each acid, alcohol and ester, and a very understandable 3D graph.
Then, if I want to evaluate a new compound with In Silico, I use Y-MB function of HSPiP software to get 8 data from Smiles structure of molecule. (Ver.5.3 does not have dDvdw, dDfg, DN, AN predictions yet.) Then, plot them in PCA space and judge by what colors are around them.
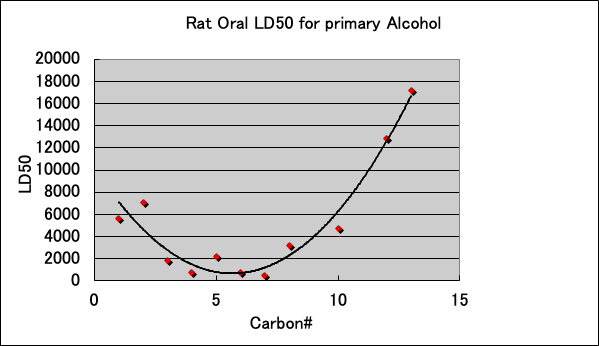
The acute toxicity (LD50) of primary alcohols to Rat is as follows.
The toxicity is highest when the carbon number is between 6-8. Isopropanol is not shown in the graph, but it is less toxic than n-propanol because LD50=5045. It is interesting to note that there seems to be a connection between these LD50 trends and the patch test results.
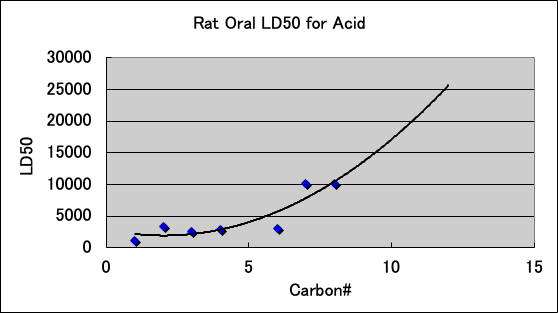
The acute toxicity (LD50) of carboxylic acids to Rat is as follows. Carboxylic acids have high PR even with 7, 8, and 10 carbon atoms. This may be due to the high electron donating (ED) nature of carboxylic acids contributing to the PR.
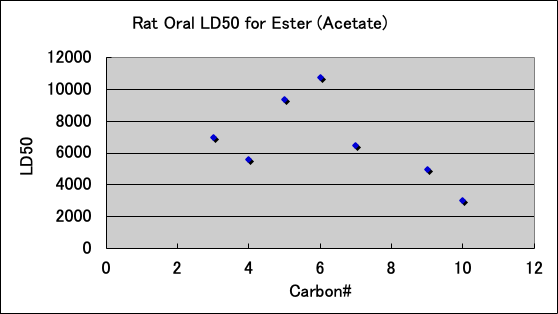
Esters are as follows. The ones that are used for food are probably not toxic.
Originally, it should be compared with the toxicity through rabbit skin, not oral toxicity.
This time, we could not collect the data, so we gave up.
We will display such toxicity data itself by collapsing the 8-dimensional vector to 3-dimensional.
If there is an opportunity, I would like to try such an analysis.