In the 1600s, when natural philosophy was replaced by natural science, astronomy, electromagnetism, and physics established methods to analyze observed data and find logic and laws. However, chemistry was left behind because it did not have a tool for observation, a thermometer.
Therefore, vague words such as “measurement at room temperature” are still prevalent.
This is even though the physical properties of density, viscosity, surface tension, specific heat, thermal conductivity, etc. change as the temperature changes.
For example, let’s consider the membrane permeability of a certain drug. When I was translating the HSPiP e-Book, there was an expression like this.
“A rigid molecule or a highly branched molecule takes much longer to find a space or “free volume” in which to wiggle. “

In other words, the size, shape, temperature, and intermolecular forces (e.g., hydrogen bonding) change the wiggle state, but temperature does not enter into the consideration because it is common to room temperature in experiments.
In pirika, temperature is considered as a converted temperature.
(This is similar to the Arrhenius plot, where the reaction rate is plotted as 1/T.)
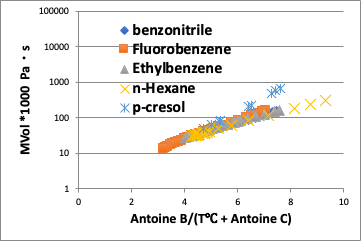
The vapor pressures of some compounds are plotted against temperature as shown in the figure on the right.
Even at the same temperature of 25°C, the vapor pressure changes by a factor of 10,000.
This would be a completely different degree of wiggle.
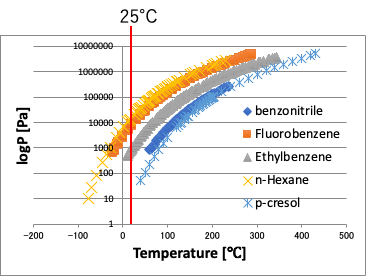
Therefore, the temperature is converted by the following equation.
Temp.pirika=Antoine B/(Antoine C + Temperature[℃])
Here, Antoine constants (A, B, C) are the constants used to calculate the vapor pressure using the Antoine equation.
Antoine Equation: log P(mmHg)=Antoine A – Antoine B/(Antoine C + Temperature[℃])
The Antoine constant is a constant for each compound, and the method to estimate it is described in another Blog, but the method is included in Y-MB of HSPiP.
In other words, I’ ll give it the same temperature effect of liquid molecules colliding and jumping from the liquid phase to the gas phase.
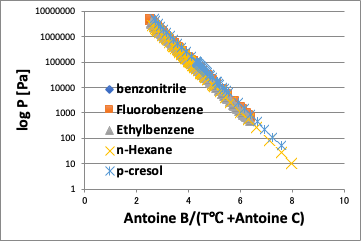
Then, for the same converted temperature, the vapor pressure will be constant regardless of the compound.
Permeation of the membrane is smaller the larger the molecule, the more rigid it is, the more cyclic it is, and the more intermolecular forces it has.
Likewise, viscosity is higher for such compounds.
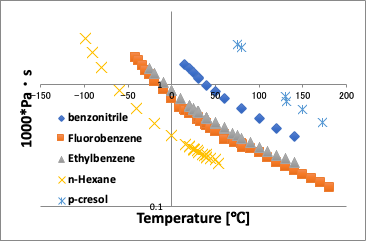
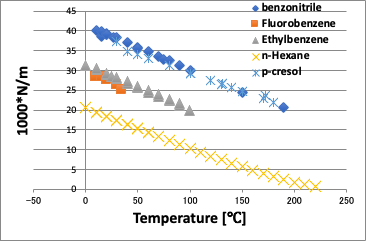
When plotted against the normal temperature, as shown in the left figure above, a curve is obtained in which the viscosity decreases as the temperature increases.
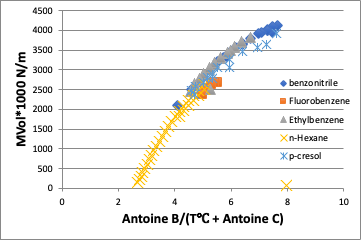
On the other hand, if you plot against the converted temperature (in this case, the vertical axis is viscosity * molecular volume because the molecular volume cannot be canceled), the difference in molecules is absorbed and the curve becomes almost a straight line.
What is very interesting here is that the p-Cresol deviates from a straight line at low temperatures below 70°C.
This is a characteristic of hydrogen bonding, and it can be inferred that there is strong hydrogen bonding at lower temperatures.
Antoine B is correlated with the latent heat of evaporation, which increases with the size of the molecule.
Antoine C is correlated with polarity, so it becomes smaller as the hydrogen bonds, etc., become larger.
When surface tension is also taken at the converted temperature, there is almost no difference between the molecules.
Now let’s consider the breaking time (BTT) of nitrile gloves. The data was collected from the following website.
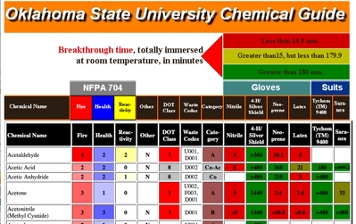
To find out what kind of compounds have a shorter breakthrough time, we plot the HSP in three dimensions.
The red color has a BTT of 10 minutes or less, orange has a BTT of 50 minutes or less, yellow has a BTT of 150 minutes or less, and blue has a BTT of 150 minutes or more.
Those with larger Z (hydrogen bonding term) tend to have larger BTT, but the red colors are widely scattered in Hansen space and do not appear to have larger or smaller BTT depending on the HSP value.
This is probably because the size of the molecule is also involved in the BTT.
So, we want to add volume to HSP and display it. To do this, we will perform PCA (Principal Component Analysis) as explained here, and shrink the multi-dimension to 3D.
Then it becomes almost a single line through three-dimensional space. The edge with a lot of red has a small molecular volume, and the opposite edge has a large molecular volume.
On the other hand, if you add the conversion temperature to the HSP and do PCA analysis, you will get a very interesting distribution. This is the visualization of BTT with solubility and wiggles.
Furthermore, the interpretation of BTT can be enriched by splitting the hydrogen bonding term and introducing E D and EA.
It may be necessary to consider the penetration of drugs into the skin by introducing the degree of wiggling in this way.